Products
- Comprehensive, advanced and automated set of stock picking strategies running on commercial platform
- Over 10 years back-tested using Monte-Carlo simulation
- Strategy and stock diversification
- Systematically selected and constantly updated, high-volume US & Israel stock groups
- Customizable market analysis strategy
- Advanced money management techniques
- Used to actively manage funds since 2005
- Consistently beats the relevant market index
Historical performance shows excessive returns
Using a computerized trading model developed by Modelitec it is possible to get a significant excess return in relation to generally accepted reference indices. The model has been tested against Tel Aviv 100 index from 2004 until the end of 2009 and NASDAQ 100 during 2001 to 2009. Evaluation of the model performance was performed by linear regression to find risk index (Beta) and excess return (Alpha) by Dr. Tal Shaked. Download the documents below (Hebrew) to view full analysis:
| TA100 |
| NASDAQ100 |
Performance of the weekly models versus NASDAQ100
The portfolio consisted of equity and hedging, up to 5% of the portfolio value. The model bypassed NASDAQ100 significantly. Click below to view full results:
| Weekly Results |
Case Studies
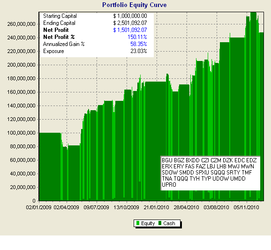
Daily swing trading model earned 150% in 2009-2010
This model uses technical analysis in order to time entry and exit on a group of leveraged 3X US ETFs. Using both bearish and bullish funds, the model is profitable even in declining market while holding only long positions. The model produces 15-20 BUY signals per year and invests 100% of capital into the signalling fund for a period of up to 4 days. Having over 66% of winning trades, the model consistently outperforms the market. Click on the image below to view the equity curve and the list of traded ETFs. For further details please contact us using this form.
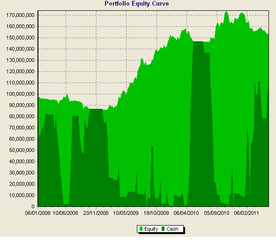
Weekly models earned over 56% from 2008
The portfolio consisted of equity only, carefully selected from TA100 index. Over the past 3 years, between January 2008 and May 2011, the portfolio gained over 53%, while TA100 index stayed flat and posted no gains at all. Click the image below to view equity curve along with level of exposure.
The portfolio consisted of equity only, carefully selected from TA100 index. Over the past 3 years, between January 2008 and May 2011, the portfolio gained over 53%, while TA100 index stayed flat and posted no gains at all. Click the image below to view equity curve along with level of exposure.
Daily model on top of Wealth-Lab strategy ranking
ORI_RiseAndFall v2 features great return with minimal exposure. Click the link to view it on Wealth-Lab website
Ori Rosen from Modelitec with others are pursuing a patent on unique trading platform. Read more here
ORI_RiseAndFall v2 features great return with minimal exposure. Click the link to view it on Wealth-Lab website
Ori Rosen from Modelitec with others are pursuing a patent on unique trading platform. Read more here
Disclaimer: Data and information is provided for informational purposes only, and is not intended for trading purposes. Neither Modelitec nor any of its data or content providers shall be liable for any errors or delays in the content, or for any actions taken in reliance thereon. By accessing the Modelitec website, a user agrees not to redistribute the information found therein. Modelitec has not reviewed, and in no way endorses the validity of such data. Modelitec shall not be liable for any actions taken in reliance thereon. Modelitec is not a registered broker-dealer and does not endorse or recommend the services of any brokerage company. The brokerage company you select is solely responsible for its services to you, the user. Modelitec shall not be liable for any damages or costs of any type arising out of or in any way connected with your use of the services of the brokerage company.
Copyright © 2005 - 2011 Modelitec. All Right Reserved.

